SciWork manages tasks in the MIRACLE project trajectory, collecting and collating data such as answers to questions, tweets, images, and videos produced by the students. The software guides the learning process and the organization and reflection of what is learned.
Students complete tasks by submitting materials to a digital portfolio in which they flag selections that best represent their learning for later review. A tabbed menu guides their activities through sections that follow a research-defined trajectory that includes collaborating through tweeting, graphically arranging messages, typing answers to questions in predefined areas, selecting photographs and videos posted from mobile devices, and observing and commenting on an animated simulation. This culminates with the students combining materials from those prior sections into a news article.
Six colour-coded groups may log in concurrently on their respective devices, connecting through the SciHub server to store and retrieve data. In addition a teacher login provides management and overview panels (Figure 7) of the data submitted by student groups. This overview panels allow teachers to X, Y, and Z enabling the teacher to follow specific trajectory tasks.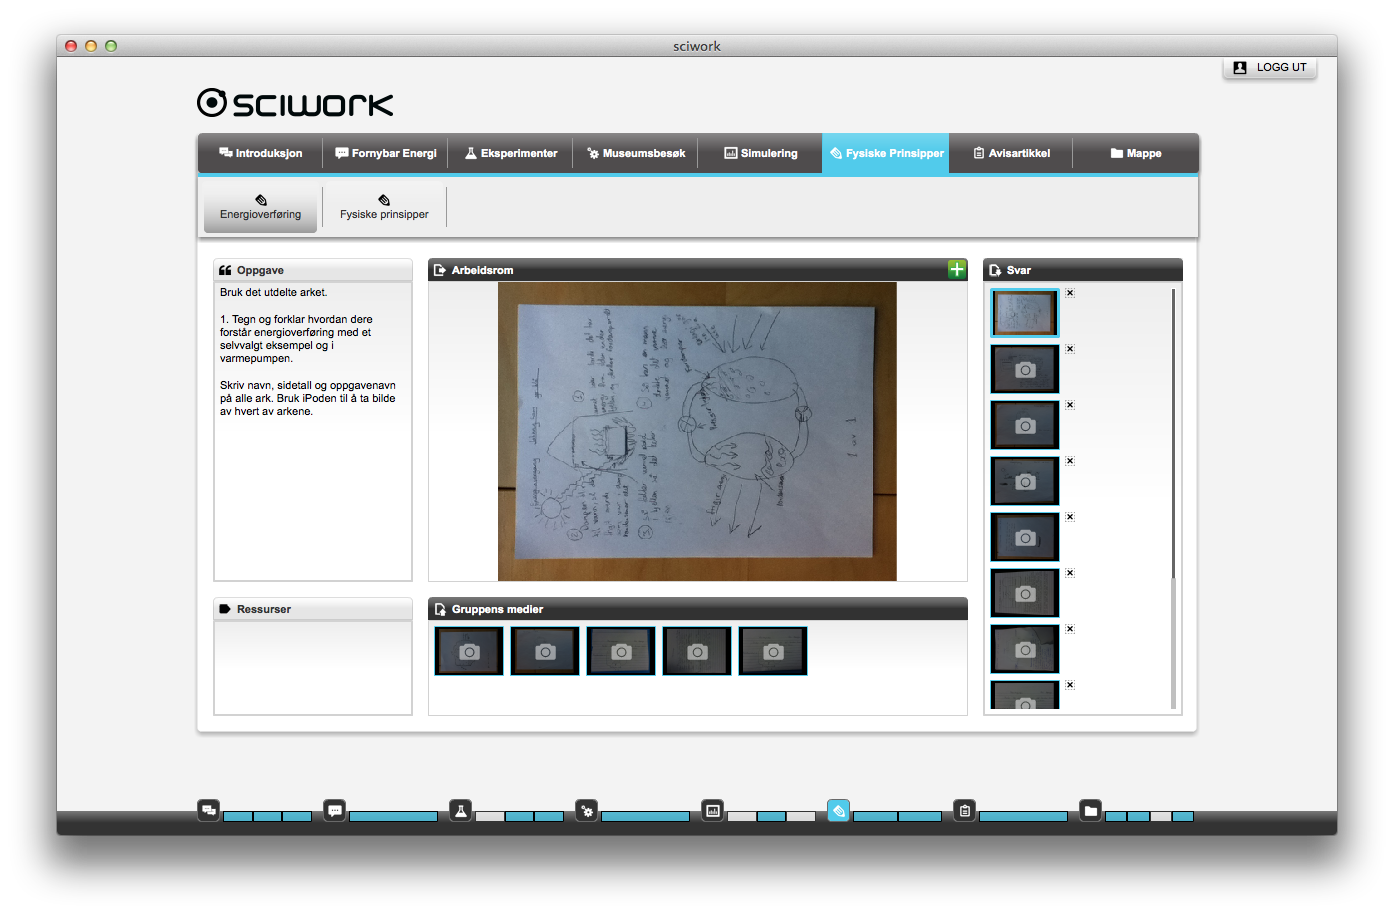
Figure 1. Student interface in SciWork.
The user interface, created with the Adobe Flash / ActionScript language, allows for multiple platform support. Google Docs provides a simple, automatic, sharable document editor for the news article assignment.
SciWork architecture has been designed to best align with the defined trajectory. A careful study of the task steps reveals patterns of operation that help to translate definition into operational software. In most cases this allows for a consistent user interface; however, in some instances, a different screen mode is necessary for clearer presentation of information in the space available. The server saves student data, allowing students to return to work another time as well as share information among peers. For researchers, the server stores additional background information such as statistics showing X and Y.
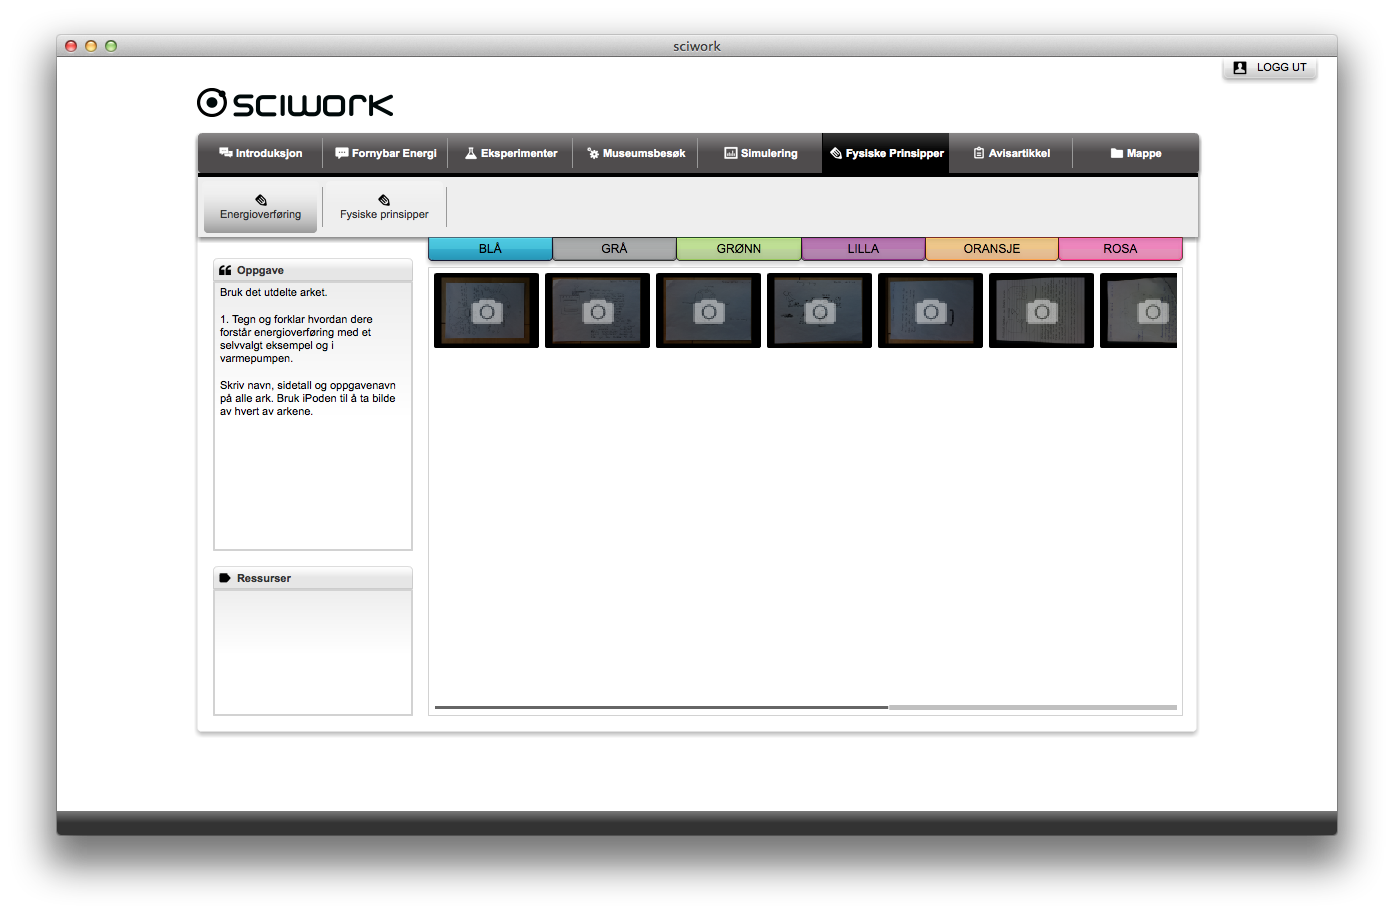
Figure 2. Teacher interface in SciWork.
The numerous interactions with the various servers is illustrated below (Figure 3):
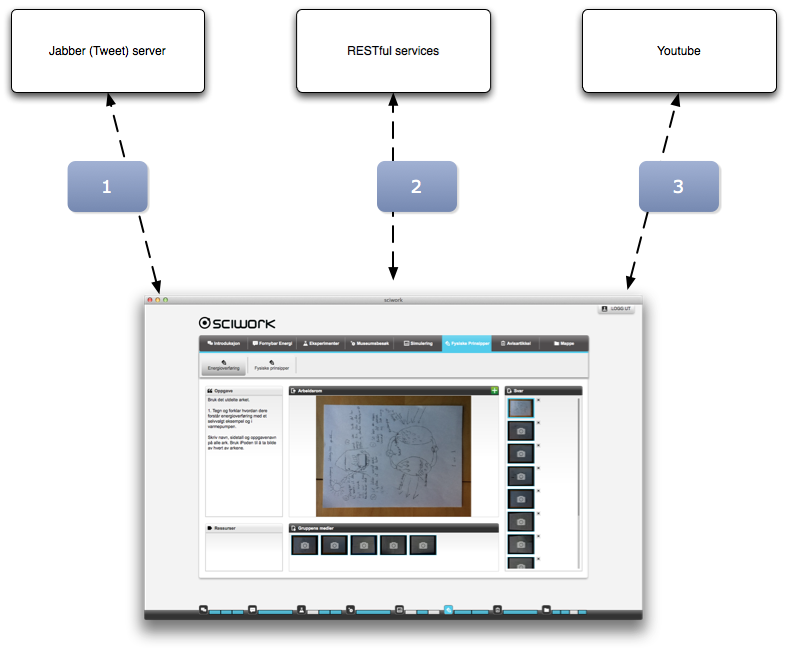
Figure 3. SciWork relations to the various services.
- Tweets: posted/retrieved to/from a Jabber tweet service (1,2)
- Pictures: posted to the RESTful service (2)
- Videos: posted to a private Youtube account first, with the reference to the video posted to the RESTful service if successful (2,3)